Where the snow falls
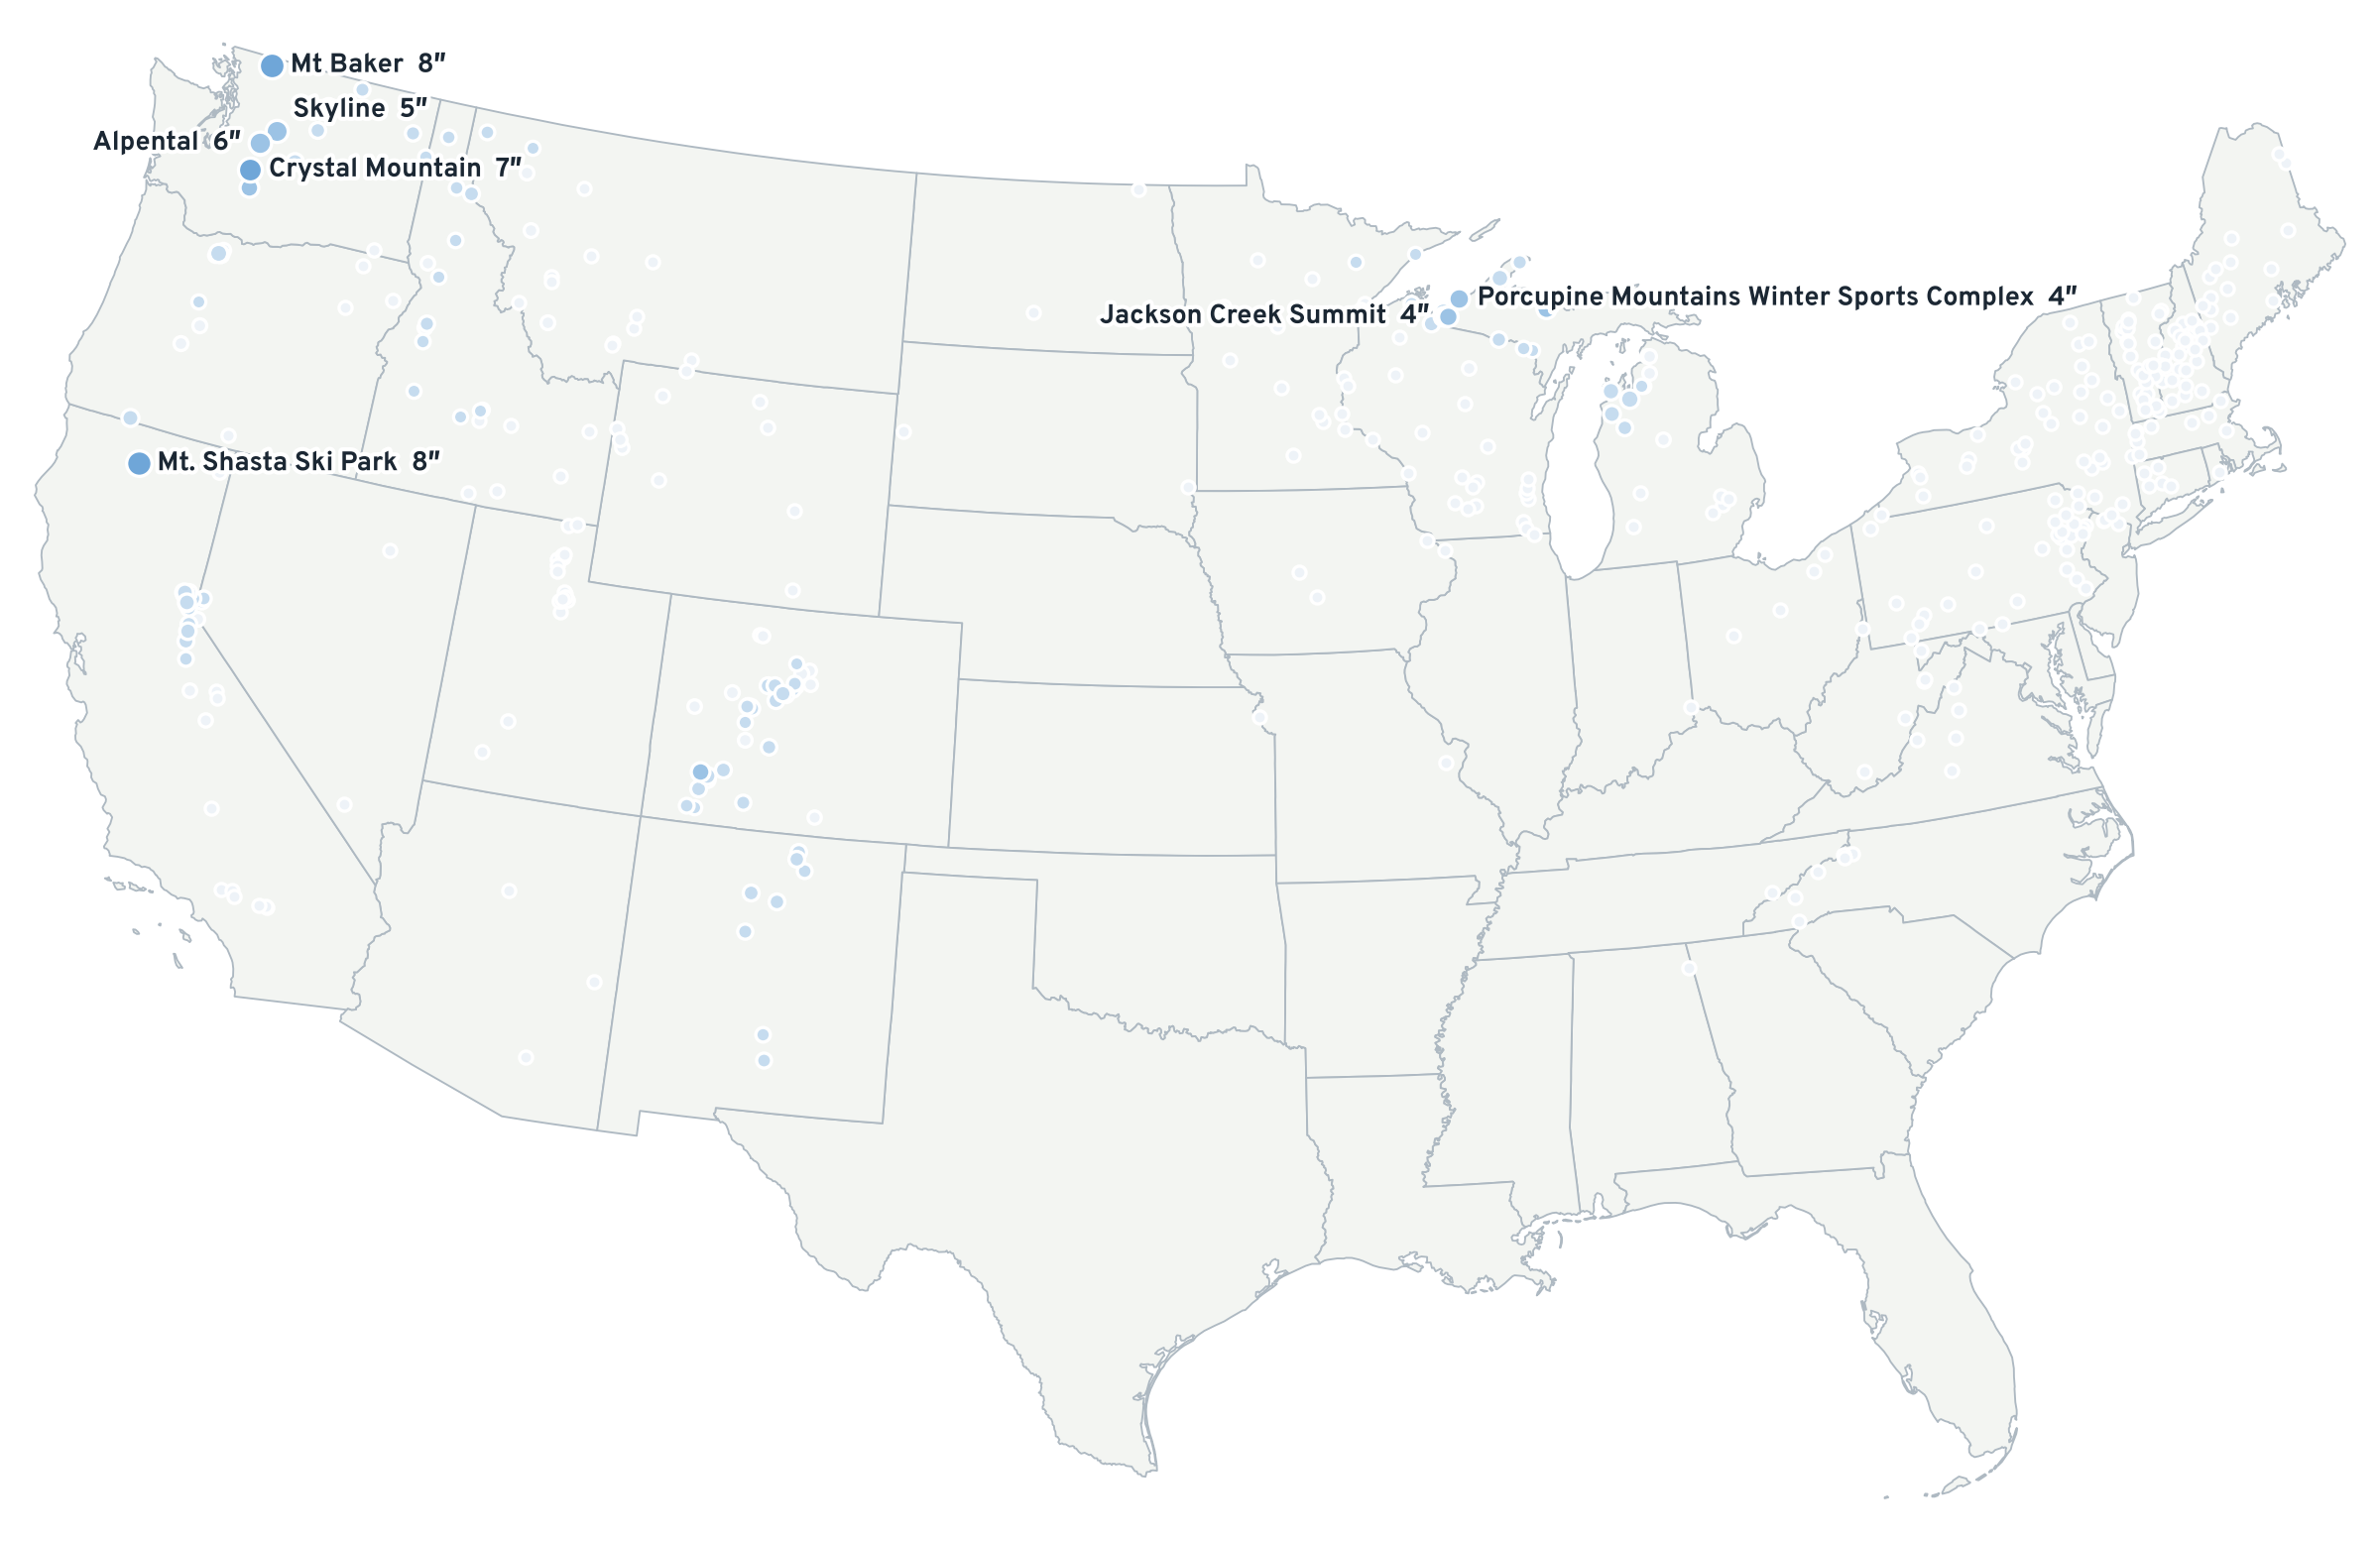
Forecast new snow on 1 km terrain, drawn in an equal-area projection so every mountain range is shown at its true size. Hover or tap for the number; tap a dot for its forecast.
This map needs WebGL 2, which this browser has turned off. Here is the same forecast as a picture.
Why the map looks like this
Most web maps use Web Mercator, which stretches the northern Rockies and the Cascades to look about a third larger than the Sierra or the San Juans. This one is drawn in Albers equal-area (EPSG:5070), the projection the USGS uses for the Lower 48, so a patch of purple in Washington covers as many square miles as the same patch in Colorado.
The snow is stored as numbers, not colors: each map tile carries inches of new snow (or the chance of a foot), and your browser colors them. That is why the threshold and the layers change instantly.
What you are looking at
- 72 h total · ECMWF 0.1° downscaled to 1 km · Sat 5 PM to Tue 5:00 PM MST
- Sun · ECMWF 0.1° downscaled to 1 km · Sun 5 AM to Mon 5:00 AM MST
- Odds 12″+ · ECMWF ENS: share of members with 12″ or more, 72 h · Sat 5 PM to Tue 5:00 PM MST
- ENS median 72 h · ECMWF ENS median, members downscaled one by one · Sat 5 PM to Tue 5:00 PM MST
Ski areas are colored by their own summit-band forecast, which uses each mountain's 500-ft bands and is sharper than the 1 km field around it. How the forecast is made